The Background: From Corporate Reporting to Product Accounting
The global trade landscape is undergoing a massive shift. For decades, companies focused on “Corporate Sustainability”—reporting the total electricity used at headquarters or the fuel used by their fleet. However, global regulators and consumers have realized that the most significant environmental impact isn’t just how a company operates, but what is physically inside the products they sell.
Historically, ESG reporting followed the GHG Protocol at a high level:
Scope 1: Direct emissions (your boilers, your company cars).
Scope 2: Indirect emissions (the electricity you buy).
Scope 3: Supply chain emissions (everything else).
While this works for annual reports, it doesn’t tell a buyer the “carbon cost” of a single steel bolt or a bottle of vitamins. As countries implement Carbon Border Adjustment Mechanisms (CBAM), they are moving the tax from the company to the Product. This means if you export a product to the EU, you are no longer just a “Manufacturing Company”—you are a carrier of “Embedded Emissions.” With regulations like the EU’s Carbon Border Adjustment Mechanism (CBAM) and similar global frameworks, “Company-wide Scope 1 & 2” reports are no longer sufficient for trade. Exporters must now calculate the Specific Embedded Emissions (SEE) of individual goods. Failure to do so accurately results in the application of “default values,” which are typically set to the highest emission intensity levels, leading to maximum tariff costs.
What is Product-Level Embedded Emissions?
Embedded Emissions (also known as “embodied carbon”) refer to the sum of all greenhouse gases emitted to produce a specific good, from the moment a raw material is extracted from the earth until the product leaves your factory gate.
Think of it as a “Carbon Shadow” that follows every physical item. It includes:
- Direct Processing: The heat and chemistry used to transform materials.
- Indirect Energy: The power used by the CNC machines, mixers, or dryers on the shop floor.
- Precursor Impact: The emissions created by your suppliers to make the materials they sold to you.
The “Cradle-to-Gate” Boundary
In the context of trade and tariffs, we usually measure emissions from Cradle-to-Gate:
- Cradle: Extraction of raw materials (mining ore, harvesting botanicals).
- Gate: The point at which the finished product leaves your manufacturing facility.
Example: Cradle-to-Gate for Nutraceuticals Manufacturer
If you are manufacturing a Vitamin D supplement, the “gate” is your warehouse. The embedded emissions include the energy to grow the raw source, the chemicals used for extraction, the electricity for the tablet press, and the carbon footprint of the plastic bottle. It excludes the emissions from the customer driving to the store to buy it.
Why Does This Matter Now?
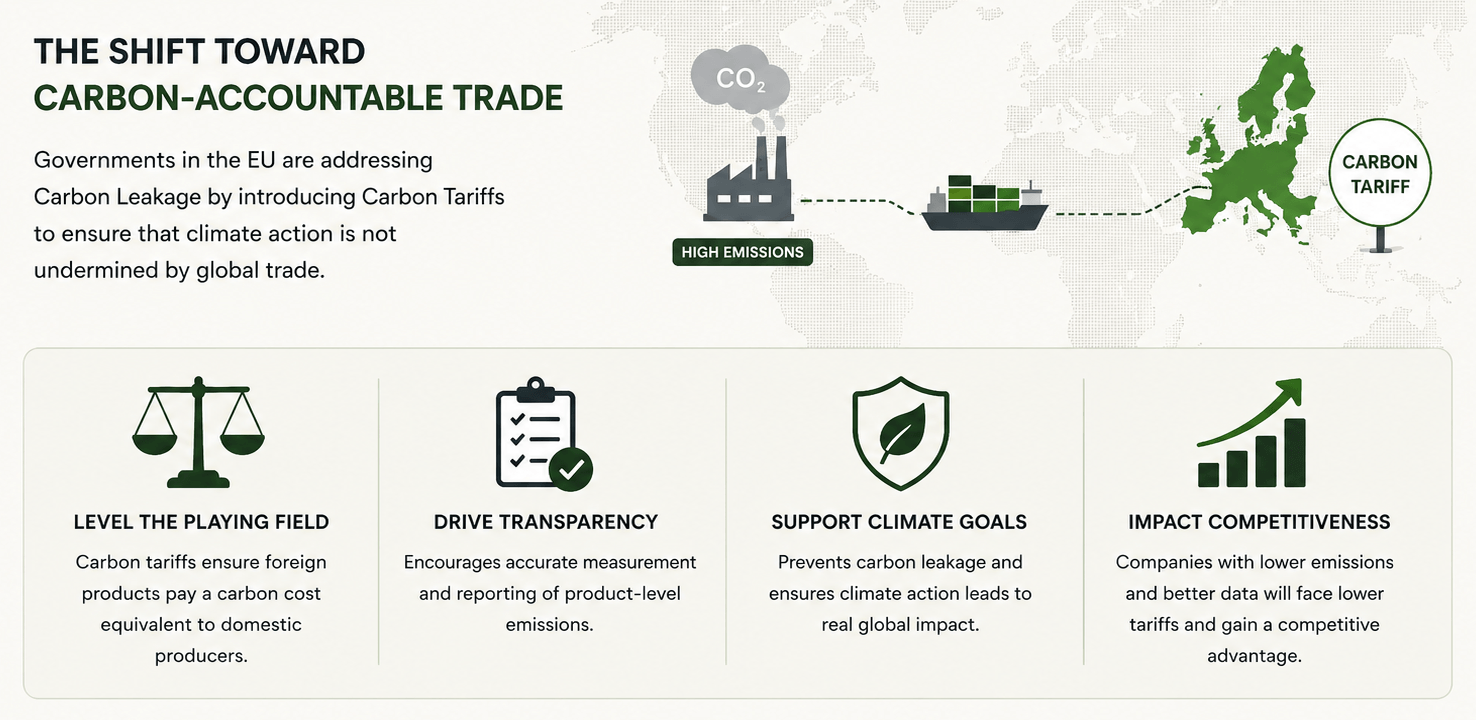
The primary driver is Carbon Leakage. Government in EU is worried that if they tax their own factories for carbon, companies will simply move production to countries with no carbon tax.
To prevent this, they are introducing Carbon Tariffs:
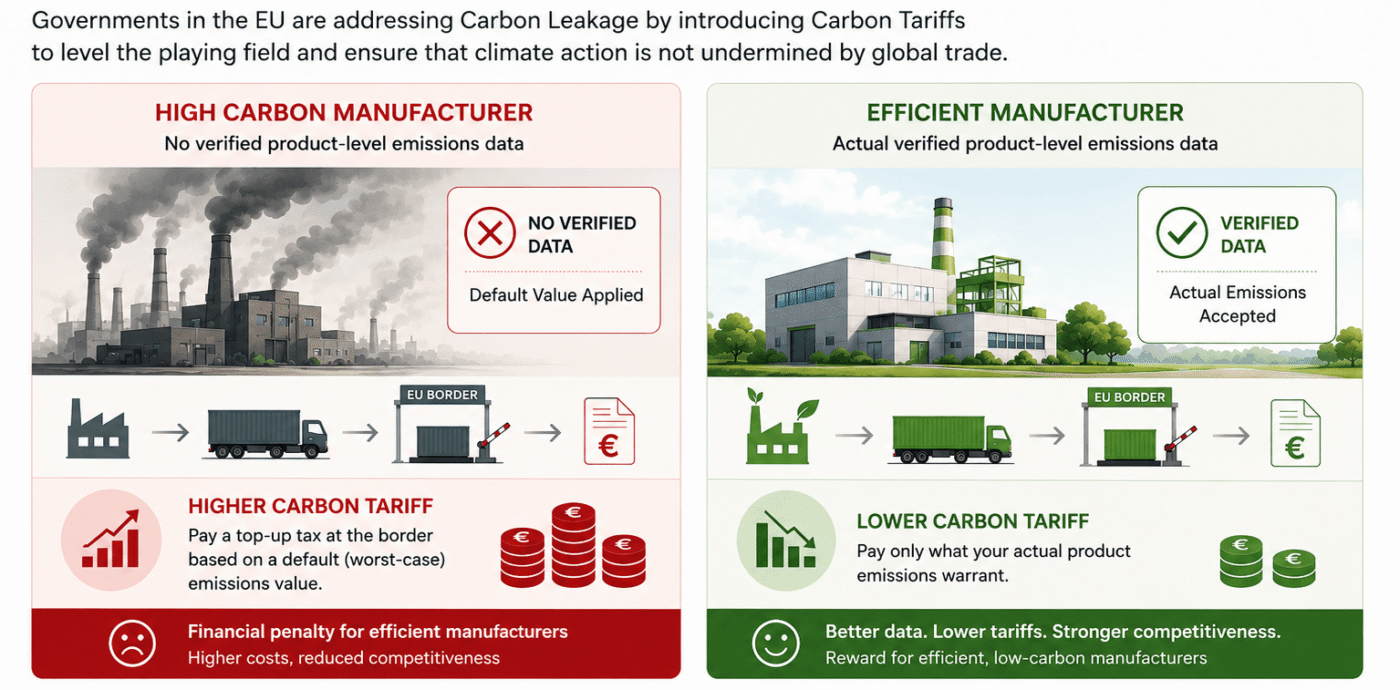
- Levelling the Playing Field: If your product has a high carbon footprint, you pay a “top-up” tax at the border to match the carbon price paid by domestic manufacturers.
- Default Values vs. Actuals: If you cannot prove your product-level emissions with data, regulators will assign you a Default Value—usually based on the worst-performing 10% of the industry. This is a massive financial penalty for efficient manufacturers.
As carbon border regulations evolve, product-level emissions data is becoming essential for exporters and manufacturers. Companies that can accurately measure, verify, and reduce embedded emissions will be better positioned to lower tariff exposure, strengthen buyer confidence, and remain competitive in global markets.
The Calculation Framework (ISO 14067 / GHG Protocol)
Product-level calculation requires moving from general energy bills to “Process-based” accounting. The goal is to determine the carbon intensity per unit of output (e.g., kg CO2e per Ton of Steel or per bottle of Supplements).
Specific Embedded Emissions (SEE) = (DirEm + IndEm + PrecursorEm) / AL
Where:
DirEm = Direct Emissions
IndEm = Indirect Energy Emissions
PrecursorEm = Embedded emissions in raw materials
AL = Activity Level (total production volume)
The Core Calculation Framework (ISO 14067)
To calculate Specific Embedded Emissions (SEE) for a product, you must transition from “Facility-wide” data to “Product-specific” data. The goal is to find the total kilograms of CO2e per unit of production.
The Master Formula:
SEE=DirEm+IndEm+PrecursorEmALSEE=ALDirEm+IndEm+PrecursorEm
Where:
- DirEm (Direct Emissions): Fuel burned on-site for the specific production line (e.g., Natural gas for boilers).
- IndEm (Indirect Emissions): Electricity and steam consumed by the specific machines and processes.
- PrecursorEm (Upstream): The embedded carbon already inside the raw materials you bought (from your suppliers).
- AL (Activity Level): The total number of units or tons produced during the reporting period.
Practical Calculation Example (Nutraceutical Grade Extract)
Let’s look at a manufacturing process for a Nutraceutical Grade Extract (1,000 kg batch).
|
Input Category |
Quantity |
Emission Factor (EF) |
Emissions (kg CO₂e) |
|
Raw Botanical |
5,000 kg |
0.8 kg CO₂e/kg |
4,000 |
|
Solvent (Ethanol) |
200 L |
1.5 kg CO₂e/L |
300 |
|
Electricity |
1,200 kWh |
0.7 kg CO₂e/kWh |
840 |
|
Steam Consumption |
2,000 kg |
0.2 kg CO₂e/kg |
400 |
|
TOTAL |
5,540 |
Specific Embedded Emission:
5,540 ÷ 1,000 units = 5.54 kg CO2e / kg of product.
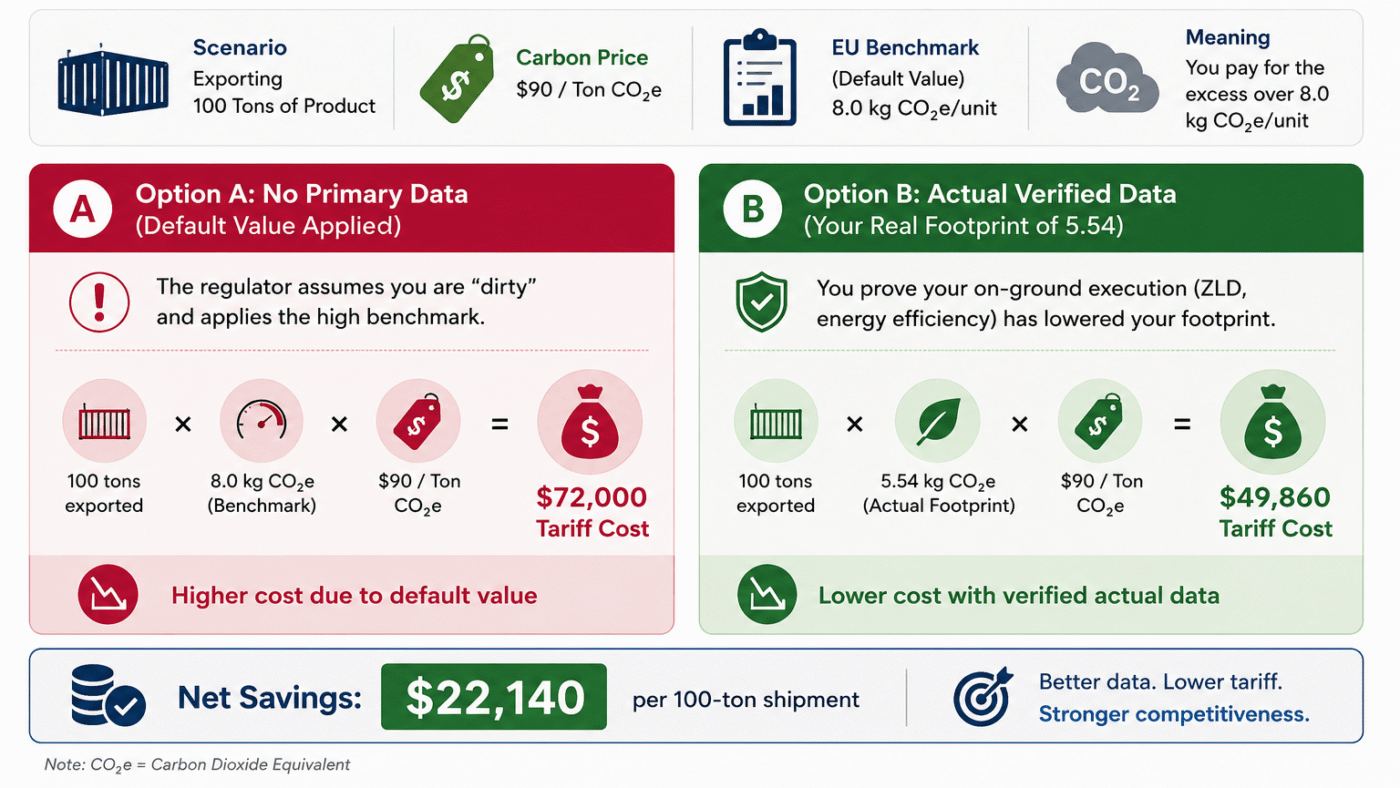
Cost-Impact Scenario
Carbon tariffs like the EU’s CBAM work by charging for the difference between your product’s footprint and a “Benchmark.”
Scenario: Exporting 100 Tons of Product
Carbon Price: $90 / Ton CO2e
EU Benchmark (Default Value): 8.0 kg CO2e/unit
Option A: No Primary Data (Default Value Applied)
The regulator assumes you are “dirty” and applies the high benchmark.
Calculation:
100 tons × 8.0 × $90 = $72,000 Tariff Cost
Option B: Actual Verified Data (Your Real Footprint of 5.54)
You prove your on-ground execution (ZLD, energy efficiency) has lowered your footprint.
Calculation:
100 tons × 5.54 × $90 = $49,860 Tariff Cost
Net Savings: $22,140 per 100-ton shipment.
Strategy to Avoid Tariffs
1.Stop Using Averages
Industry average emission factors are almost always higher than a well-run, optimized plant. Use your actual meter data to report lower numbers.
2. Focus on Steam & Water
In manufacturing, thermal energy is the “carbon hog.” Implementing steam recycling directly reduces your IndEm (Indirect Emissions), which lowers your tariff.
3. Target High-Impact Precursors
Don’t chase every supplier. Map your Bill of Materials (BOM) and only send questionnaires to the top 3-5 suppliers that contribute 80% of your mass.
Practical Examples of Embedded Emissions Reduction in Action
Example 1: The Forged Automotive Part
A manufacturer in India produces a gear for a European car brand.
- The Precursor: They buy steel billets. The steel mill used coal-fired furnaces (high carbon).
- The Process: The manufacturer uses an induction heater and a 1,000-ton press.
- The Efficiency Factor: If the manufacturer uses Steam Condensate Recovery to pre-heat their cleaning tanks, they reduce their boiler fuel consumption.
- The Result: The “Embedded Emissions” of that gear are lower because of on-ground execution, making it cheaper to export because the carbon tax at the border will be lower.
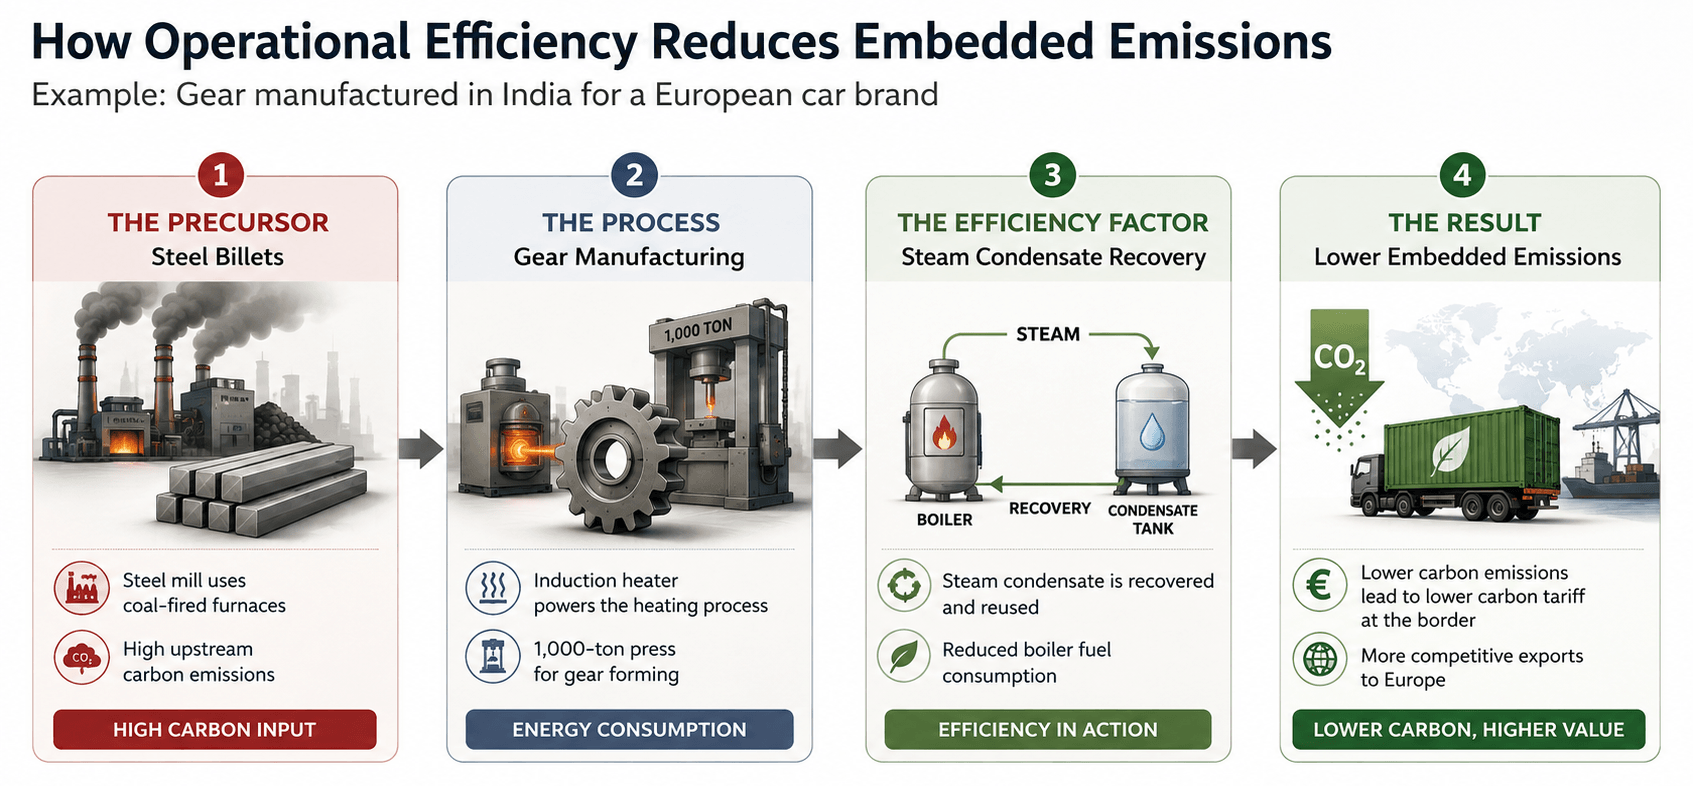
KEY TAKEAWAY
Operational efficiency directly influences the embedded emissions of manufactured products. By improving energy recovery and documenting actual process performance, manufacturers can reduce carbon tariff exposure and strengthen export competitiveness in global markets.
Example 2: The Herbal Extract (Nutraceutical)
A manufacturer in India produces ashwagandha extract for a European nutraceutical company.
- The Precursor: Raw Ashwagandha roots.
- The Process: Solvent extraction using Ethanol.
- The Efficiency Factor: Using a Zero Liquid Discharge (ZLD) system allows the plant to recycle water and potentially recover heat.
- The Result: By documenting the exact energy used per kg of extract, the company avoids the “industry average” tax, which usually assumes much higher energy waste.
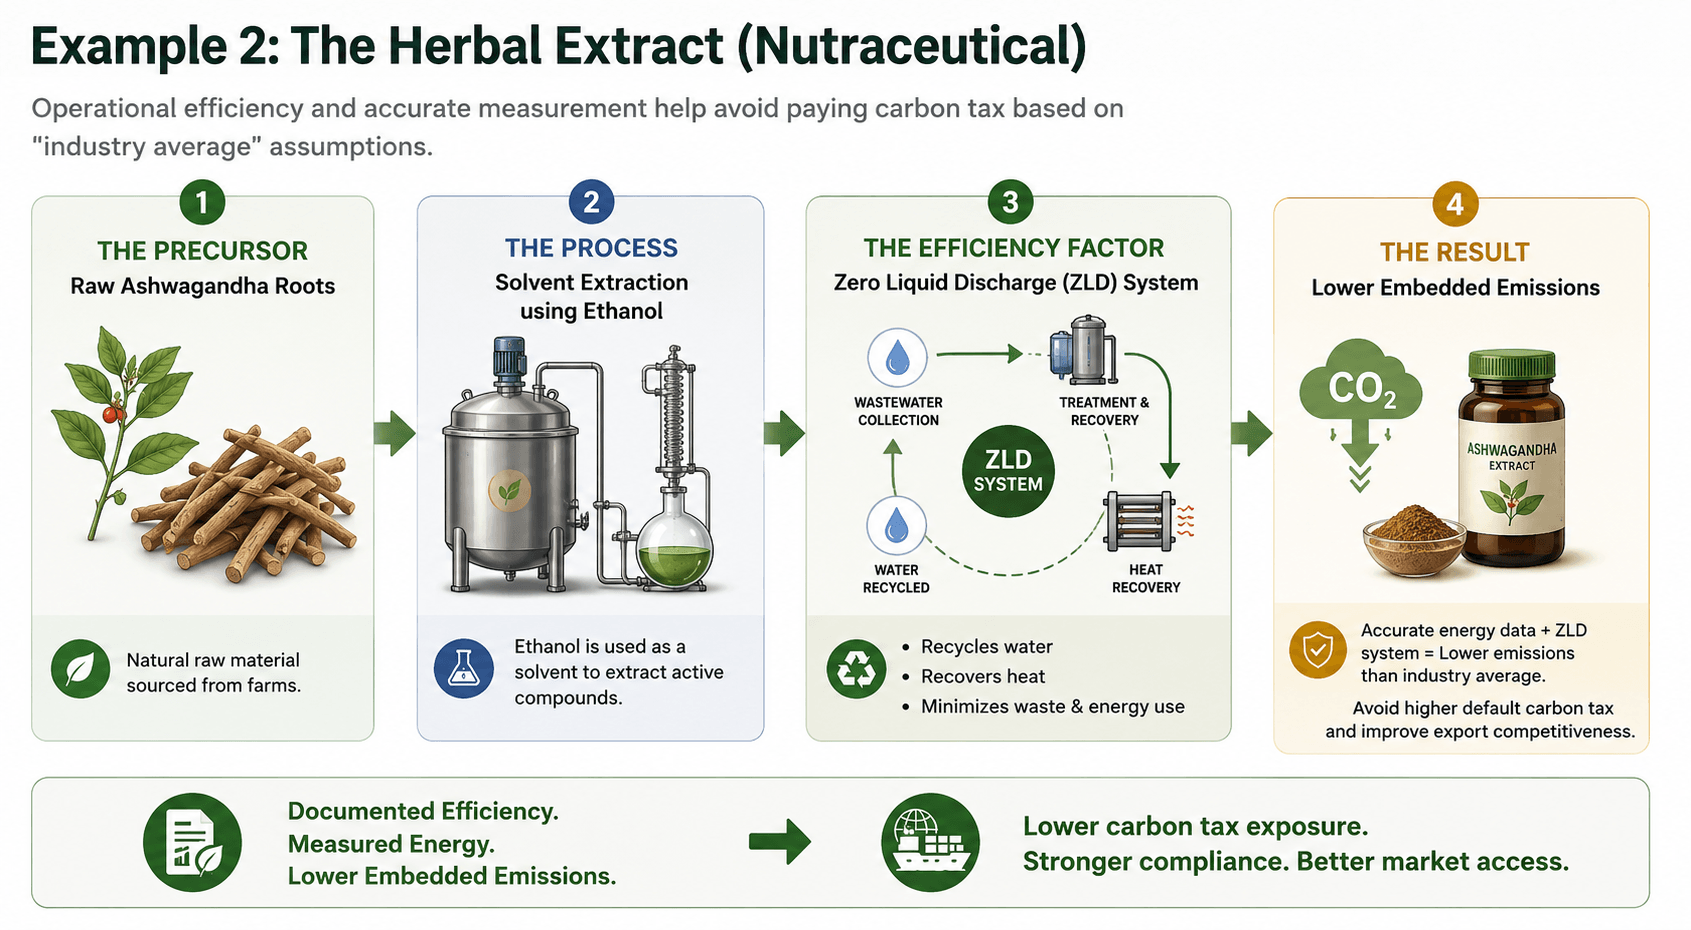
KEY TAKEAWAY
Efficient process design and accurate energy measurement can significantly reduce embedded emissions in nutraceutical manufacturing. Systems such as Zero Liquid Discharge (ZLD), heat recovery, and water recycling not only improve operational efficiency but also help manufacturers avoid higher carbon tariff assumptions linked to industry-average data.
Practical Calculation Example: Forged Metal Component
|
Input / Factor |
Consumption per Unit |
Emission Factor (EF) |
Emissions (kg CO₂e) |
|
Steel Billet (Precursor) |
1.15 kg |
2.25 kg CO₂e/kg |
2.58 |
|
Electricity (Grid) |
2.50 kWh |
0.75 kg CO₂e/kWh |
1.88 |
|
Natural Gas (Direct) |
0.40 m³ |
2.03 kg CO₂e/m³ |
0.81 |
|
TOTAL |
5.27 |
Total Embedded Emissions per Product Unit: 5.27 kg CO2e
The “Carbon Bill of Materials” (CBOM)
Just as you have a Bill of Materials (BOM) for costs and quantities, companies now need a CBOM.
Physical BOM: 1kg Steel + 0.1kg Chrome + 0.5 hours of Labor.
Carbon BOM: 2.5kg CO2e (Steel) + 0.8kg CO2e (Chrome) + 0.2kg CO2e (Energy).
Supplier Questionnaire Template
To calculate PCF, you need primary data from your supply chain. Use this template for your vendors:
Key Questions for Suppliers:
Energy Mix: What percentage of your facility’s power comes from onsite renewables or PPA?
Process Emissions: Are there direct chemical reaction emissions in the manufacturing of the material supplied?
Primary vs. Secondary Data: Is the provided PCF based on your actual facility data or an industry average?
Resource Efficiency: Do you implement steam recovery or ZLD? (This significantly lowers the footprint).
Cost-Impact Scenarios: The Tariff “Tax”
Scenario: Exporting 5,000 Units to a Carbon-Tax Region
Carbon Price: $90 per Ton CO2e
Case A:
Using Default Values (High Carbon Assumption)
Emissions per unit: 12.0 kg CO2e. Total Tax Liability: $54,000
Case B:
Using Actual Verified Data (Your Real Footprint)
Emissions per unit: 5.27 kg CO2e. Total Tax Liability: $23,715
Net Savings from Accurate Reporting: $30,285 per shipment.
Strategic Recommendations for Manufacturing Leaders
1. Identify Hotspots:
Usually, 80% of emissions come from 20% of inputs (precursors). Focus your supplier data collection there.
2. On-Ground Execution:
Improving steam condensate recycling or adopting Zero Liquid Discharge doesn’t just save water; it reduces the thermal energy required, lowering the specific embedded emissions of every unit produced.
3. Digital Audit Readiness:
Maintain a live “Carbon Bill of Materials” to respond to tariff inquiries within the required 30-90 day windows.
SUMMARY FOR LEADERSHIP
Companies that treat embedded emissions as a strategic operational metric rather than a reporting obligation will be better positioned for global trade readiness, customer trust, and long-term profitability.
Product Carbon Footprint (PCF) transparency is rapidly becoming a procurement requirement for international buyers, especially in carbon-regulated markets such as the EU.
Manufacturers that invest early in accurate product-level accounting, supplier engagement, and process efficiency will not only reduce tariff exposure but also strengthen their position in future supply chains.
Embedded emissions data will increasingly influence sourcing decisions, investor confidence, export competitiveness, and market access across industries.
In the coming years, carbon-efficient manufacturing will function as both a cost advantage and a brand differentiator in global trade.
The transition from “cost-based manufacturing” to “carbon-aware manufacturing” is already underway, and organizations that prepare early will gain measurable commercial advantages.