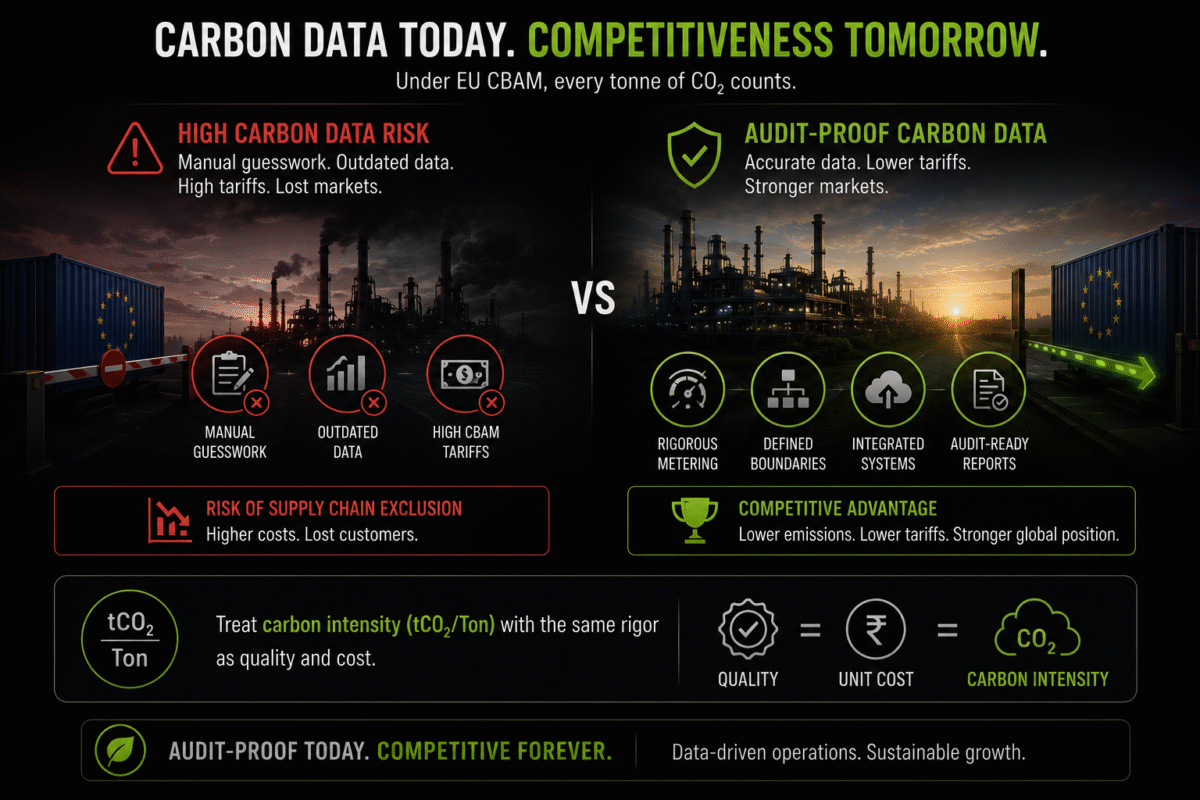
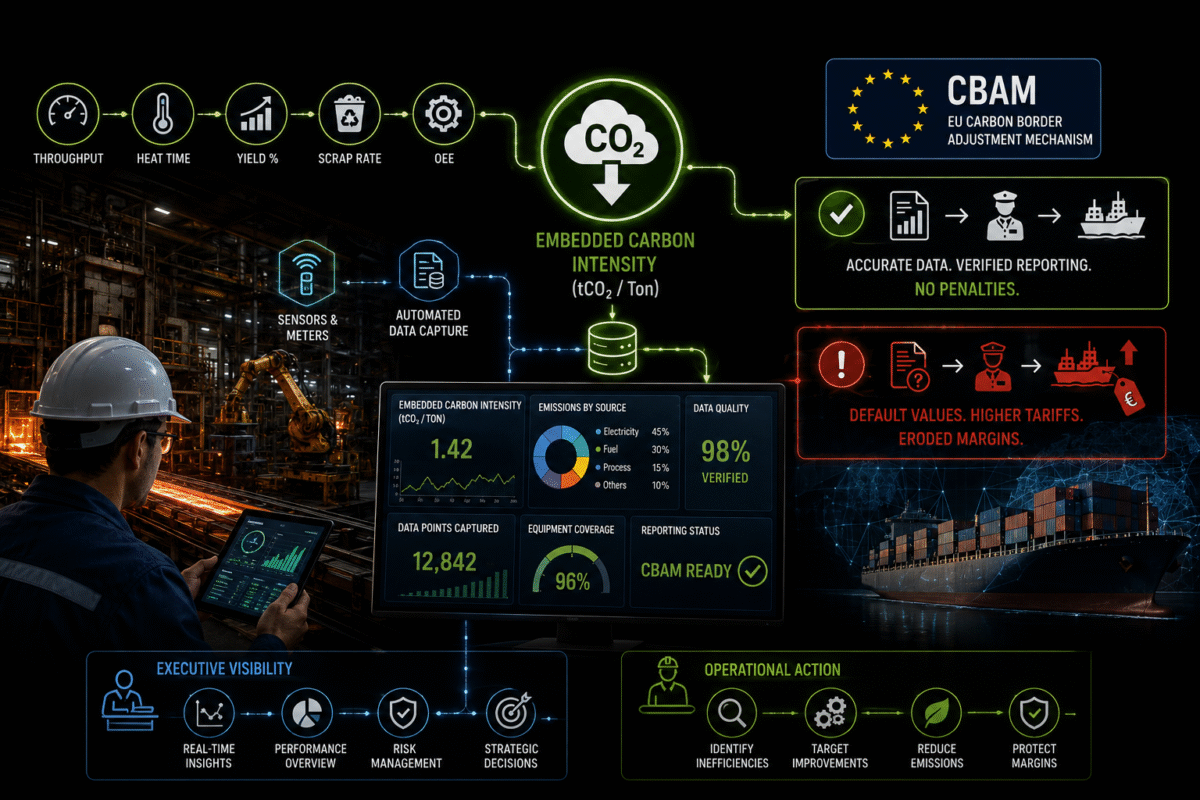
For decades, plant operations in heavy manufacturing and capital goods have run on a precise set of core metrics: throughput, heat time, yield percentage, scrap rate, and overall equipment effectiveness (OEE). Today, a new operational metric sits directly alongside unit cost and product quality: embedded carbon intensity (tCO₂/Ton).
With the implementation of the European Union’s Carbon Border Adjustment Mechanism (CBAM), reporting carbon intensity is no longer a corporate social responsibility initiative managed by a sustainability committee. It is a strict technical import rule enforced at EU customs. If plant managers fail to supply accurate, primary, and verifiable operational data, EU importers are forced to apply punitive default values—artificially inflating the carbon tariff on imported steel, iron, and capital goods, and directly eroding profit margins.
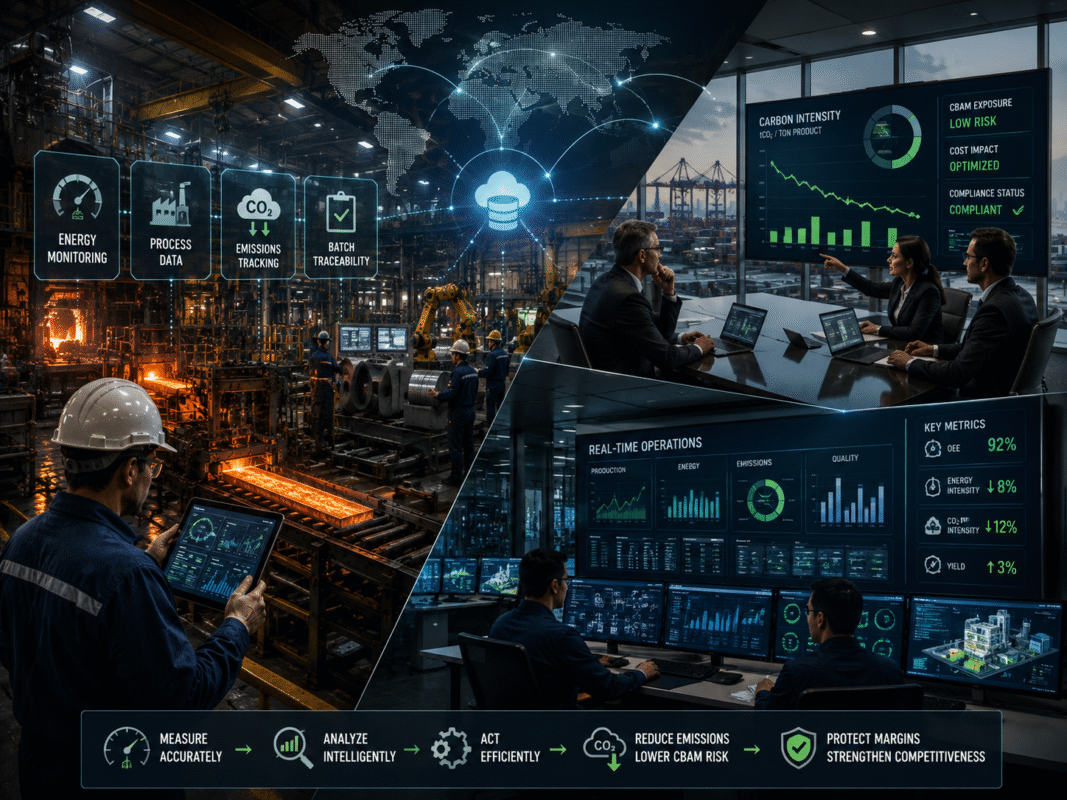
Achieving CBAM readiness requires plant heads, operations leaders, and quality teams to transform how shop-floor data is captured, measured, and verified.
Why CBAM Changes Shop-Floor Priorities
Under traditional carbon accounting frameworks like the GHG Protocol, companies often rely on regional emission factors, estimated averages, and top-down fuel invoices. CBAM completely changes this rulebook.
CBAM requires installation-level and process-specific tracking of actual embedded emissions. The mechanism looks strictly at how much greenhouse gas was emitted to create a specific physical ton of finished product leaving your facility.
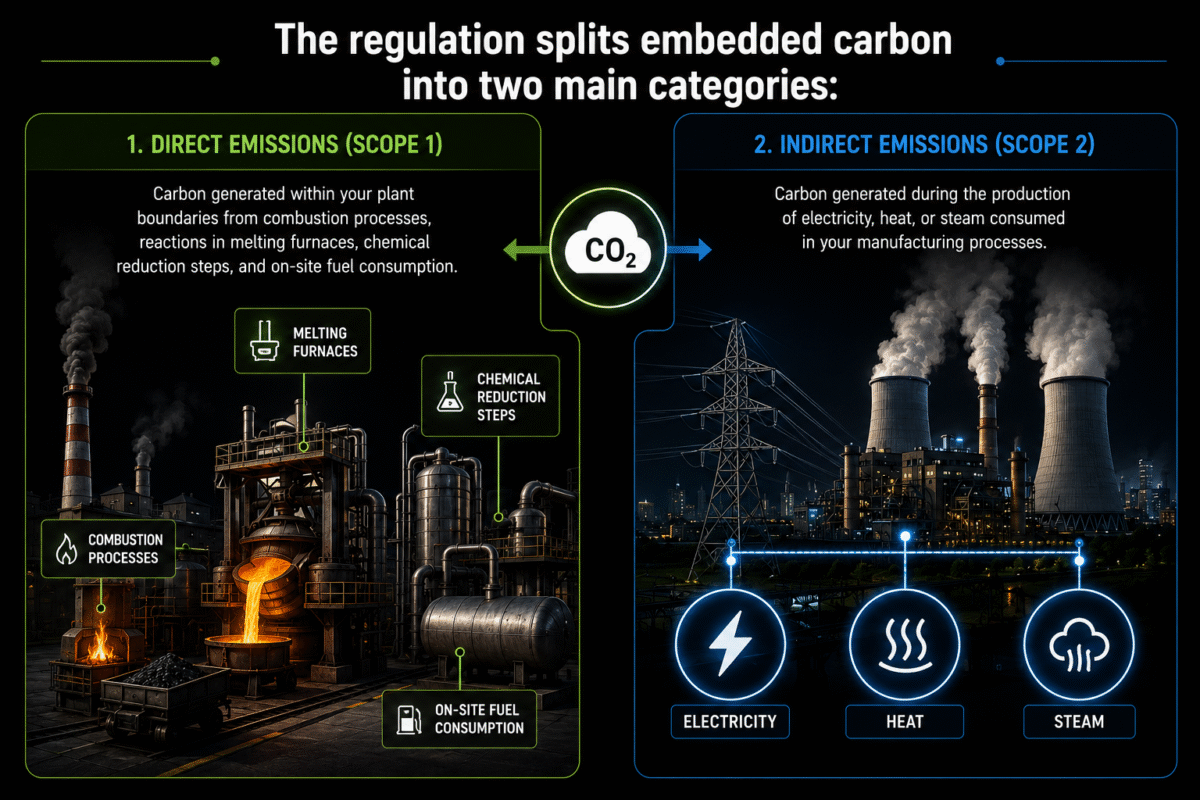
The regulation splits embedded carbon into two main categories:
-
Direct Emissions (Scope 1): Carbon generated within your plant boundaries from combustion processes, reactions in melting furnaces, chemical reduction steps, and on-site fuel consumption.
-
Indirect Emissions (Scope 2): Carbon generated during the production of electricity, heat, or steam consumed in your manufacturing processes.
If your plant cannot provide primary data calculated using EU-approved methodologies, your EU buyers will be taxed based on benchmark default figures—typically calculated using the worst-performing production routes in the exporting region. To protect market share and unit economics, shop-floor teams must make carbon data as precise as dimensional tolerances.
Step 1: Mapping the Installation and System Boundaries
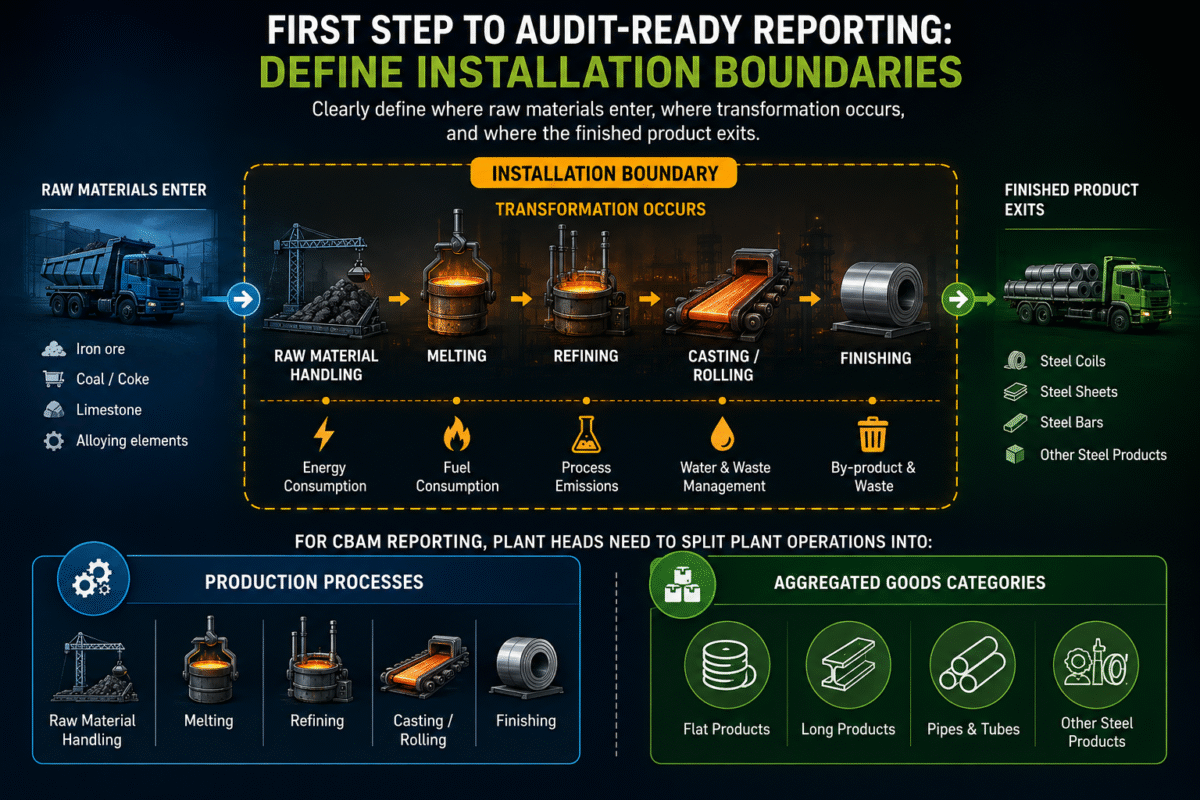
The first operational step toward audit-ready reporting is establishing strict installation boundaries. In a heavy manufacturing facility, you must clearly define where raw materials enter, where transformation occurs, and where the finished product exits.
For CBAM reporting, plant heads need to split plant operations into clear Production Processes and Aggregated Goods Categories.
Defining Process Boundaries
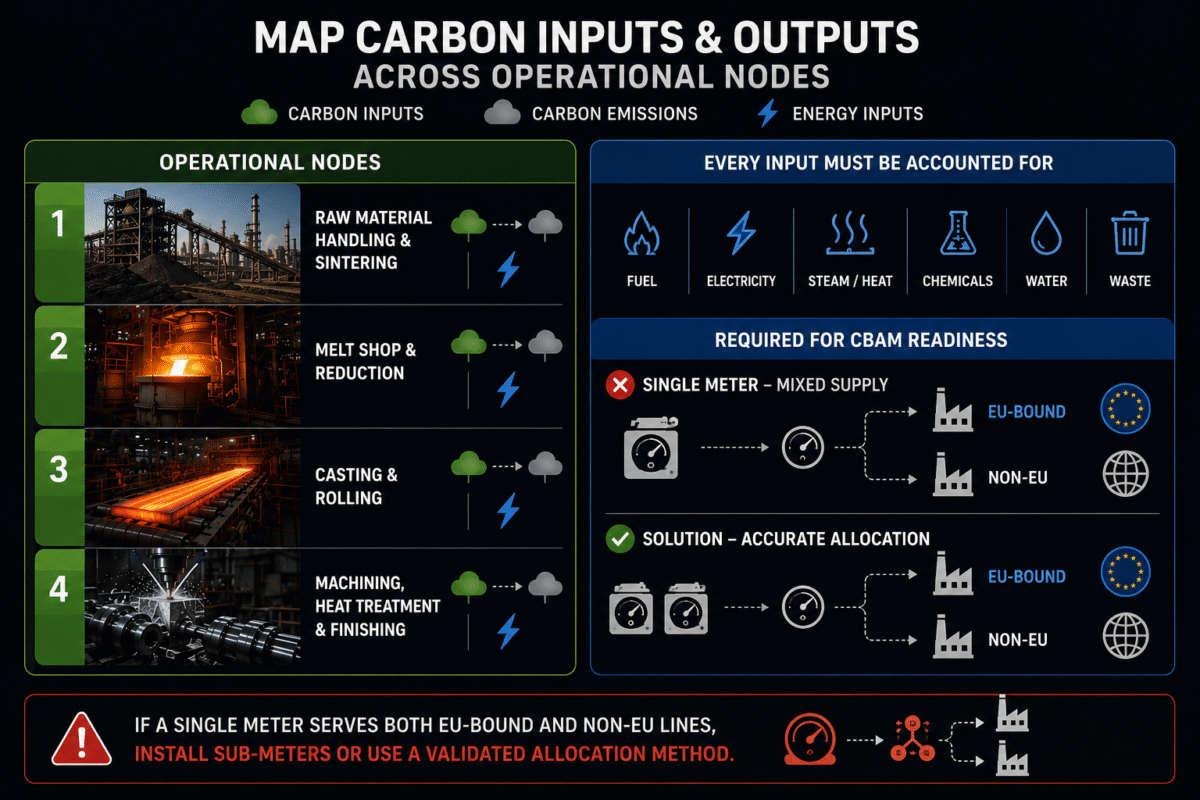
A typical capital goods or iron and steel plant must map carbon inputs and outputs across distinct operational nodes:
-
Raw Material Handling & Sintering: Carbon released during feedstock preparation.
-
Melt Shop & Reduction: Direct process and combustion emissions from Blast Furnaces (BF), Induction Furnaces, or Electric Arc Furnaces (EAF).
-
Casting & Rolling: Combustion of natural gas, LPG, or fuel oil in reheating furnaces, combined with heavy electrical loads during rolling mill passes.
-
Machining, Heat Treatment, & Finishing: Specific energy consumption during final shaping, tempering, and surface treatment.
Every energy stream and chemical reaction entering these boundaries must be accounted for. If a single meter measures fuel for both an EU-bound production line and a non-EU line, operational teams must install sub-meters or establish a validated, physical allocation methodology.
Step 2: Tracking Material Precursors and Scope 3 Inputs
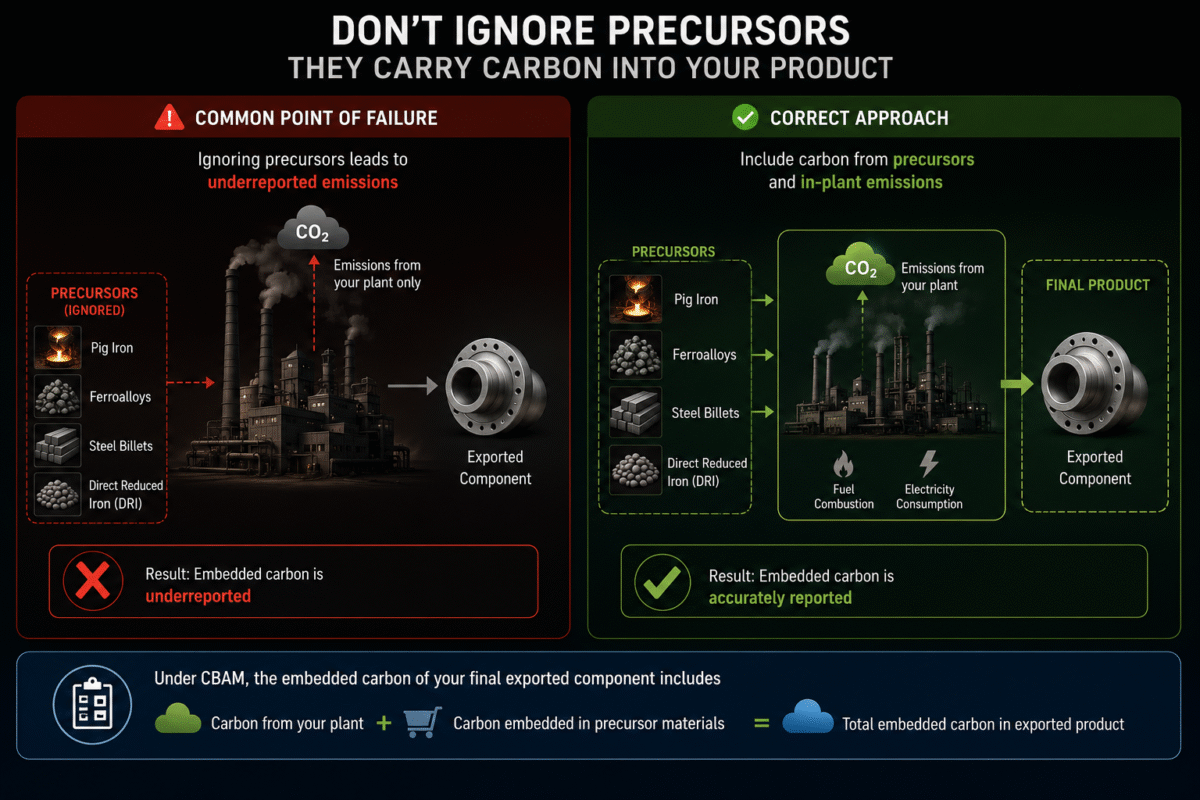
A common point of failure in plant-level CBAM accounting is ignoring precursors. Precursors are carbon-intensive raw or semi-finished materials purchased from external suppliers and consumed in your production process (for example, pig iron, ferroalloys, steel billets, or direct reduced iron).
Under CBAM, the embedded carbon of your final exported component includes the carbon generated inside your plant plus the carbon already embedded in those precursor materials.
The Precursor Data Challenge
If you buy steel billets from an upstream vendor and forge them into industrial valves, your plant head cannot simply look up an industry average for billet emissions. You must request verified supplier-specific data indicating the precise tCO₂/Ton of that specific lot.
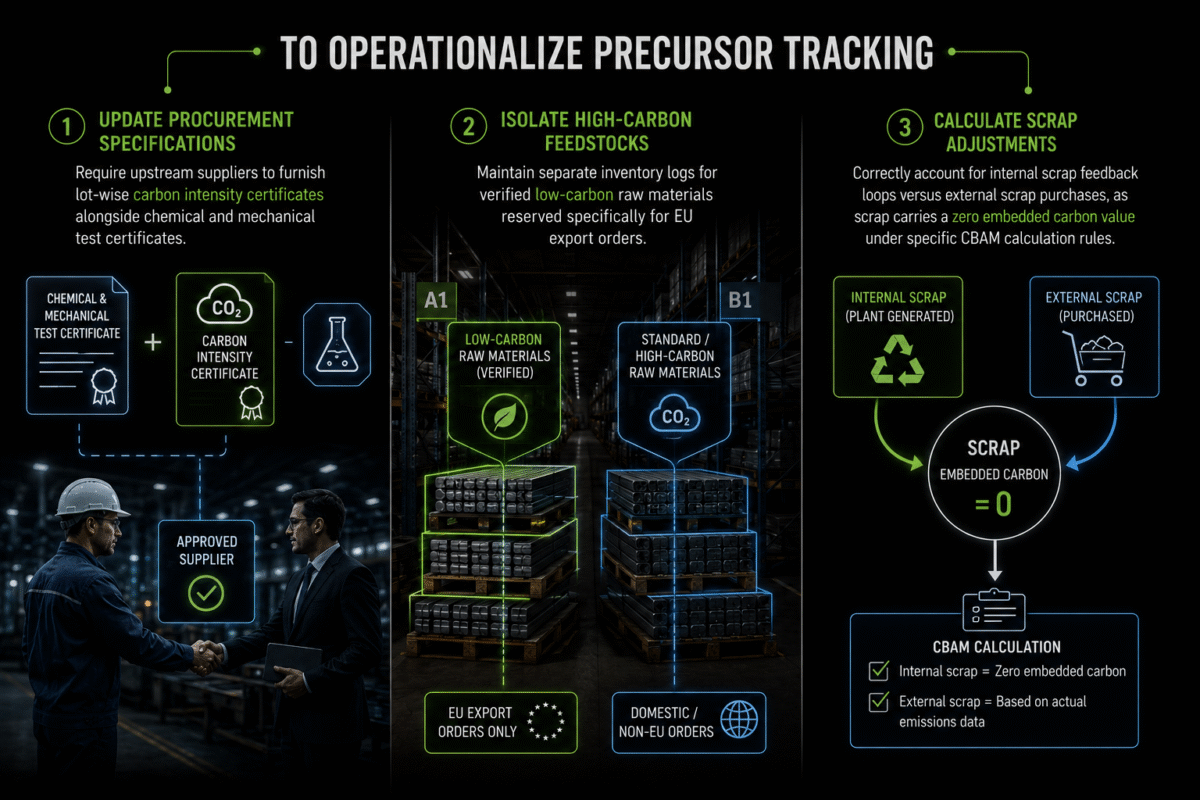
To operationalize precursor tracking:
-
Update Procurement Specifications: Require upstream suppliers to furnish lot-wise carbon intensity certificates alongside chemical and mechanical test certificates.
-
Isolate High-Carbon Feedstocks: Maintain separate inventory logs for verified low-carbon raw materials reserved specifically for EU export orders.
-
Calculate Scrap Adjustments: Correctly account for internal scrap feedback loops versus external scrap purchases, as scrap carries a zero embedded carbon value under specific CBAM calculation rules.
This makes precursor traceability a critical part of plant-level carbon accounting.
Procurement, stores, production, and sustainability teams must be able to trace each precursor from supplier → lot → inventory → production batch → finished product.
Without this chain of evidence, accurate embedded-emissions reporting becomes difficult to defend during verification.
The objective is simple: know what carbon entered the plant, where it went, and which export product carries it.
Step 3: Upgrading Data Collection from Estimations to Direct Measurement
An auditor validating your CBAM declarations will not accept spreadsheets populated with yearly averages divided by total production. Audit-proofing requires primary data collection tied directly to production batches or heat numbers.
Implementing Metering and Monitoring Infrastructure
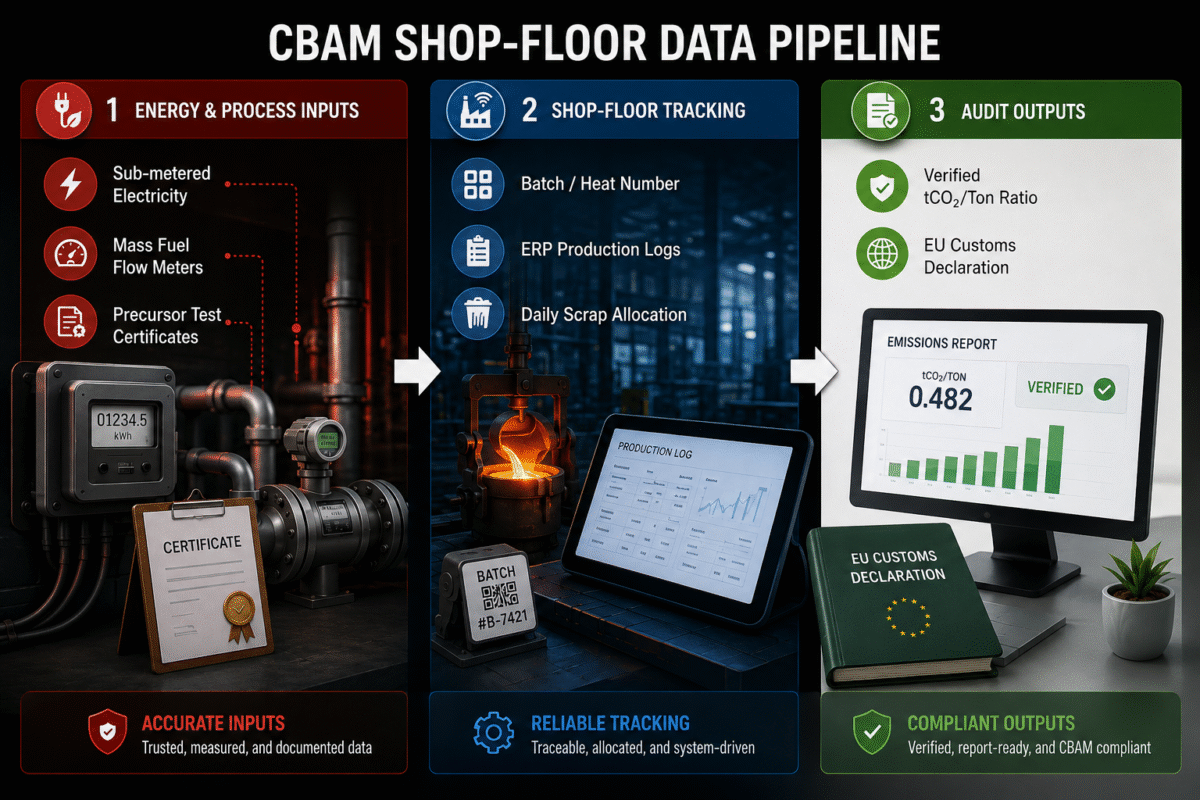
Plant engineers must audit their existing instrumentation and fill critical measurement gaps:
-
Mass Fuel Flow Meters: Install digital, calibrated flow meters on all major burners, reheating furnaces, and boilers to record direct fuel consumption per shift.
-
Sub-Metering Power Distribution: Move away from single main-building utility meters. Place smart sub-meters on high-load equipment like melting furnaces, air compressors, and heavy press lines.
-
Mass Balance Calculation Systems: Track chemical carbon inputs (such as graphite electrodes, coal, coke, and fluxing agents) against carbon remaining in the finished metal and slag. The difference represents direct process CO₂ emissions.
Linking ERP and MES Systems
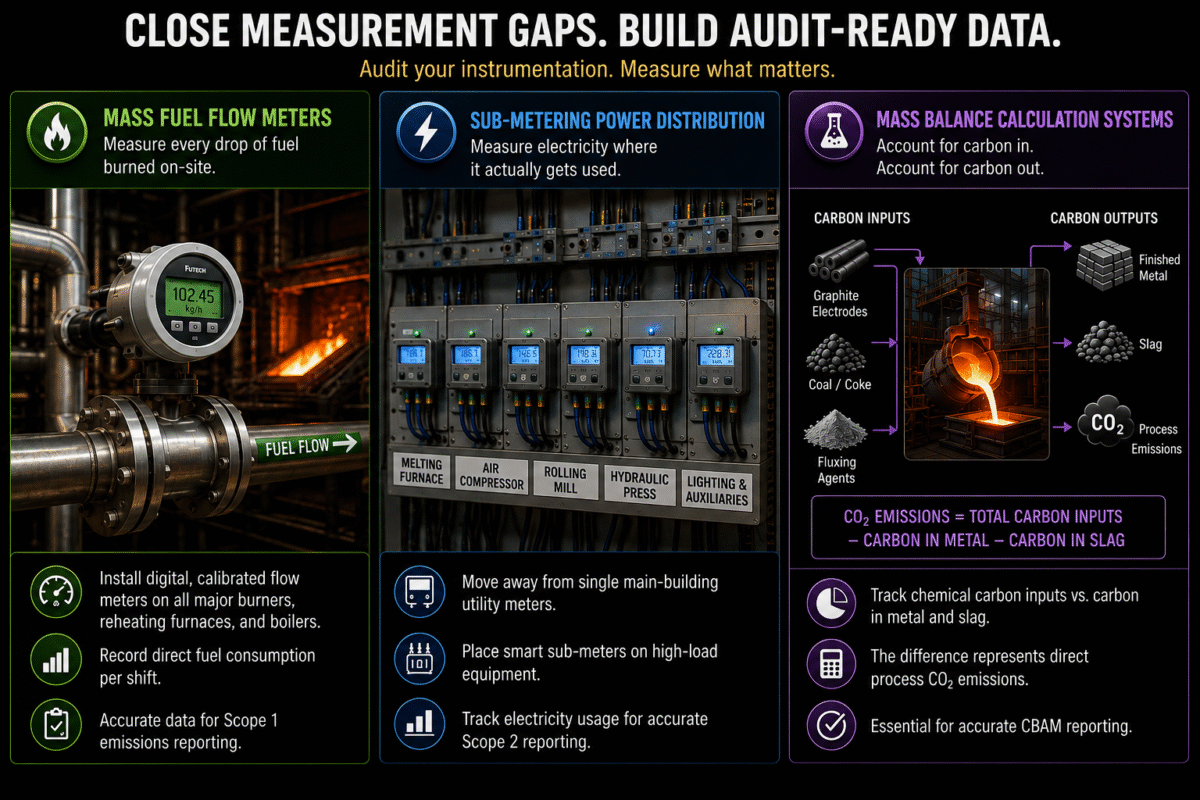
To ensure data integrity, manual logbooks should be replaced with automated integration between Manufacturing Execution Systems (MES) and Enterprise Resource Planning (ERP) platforms. Connecting energy meters directly to batch production records automatically tags each heat or part lot with its actual energy draw and corresponding carbon intensity.
Step 4: Structuring the Calculation Methodology (tCO₂/Ton)
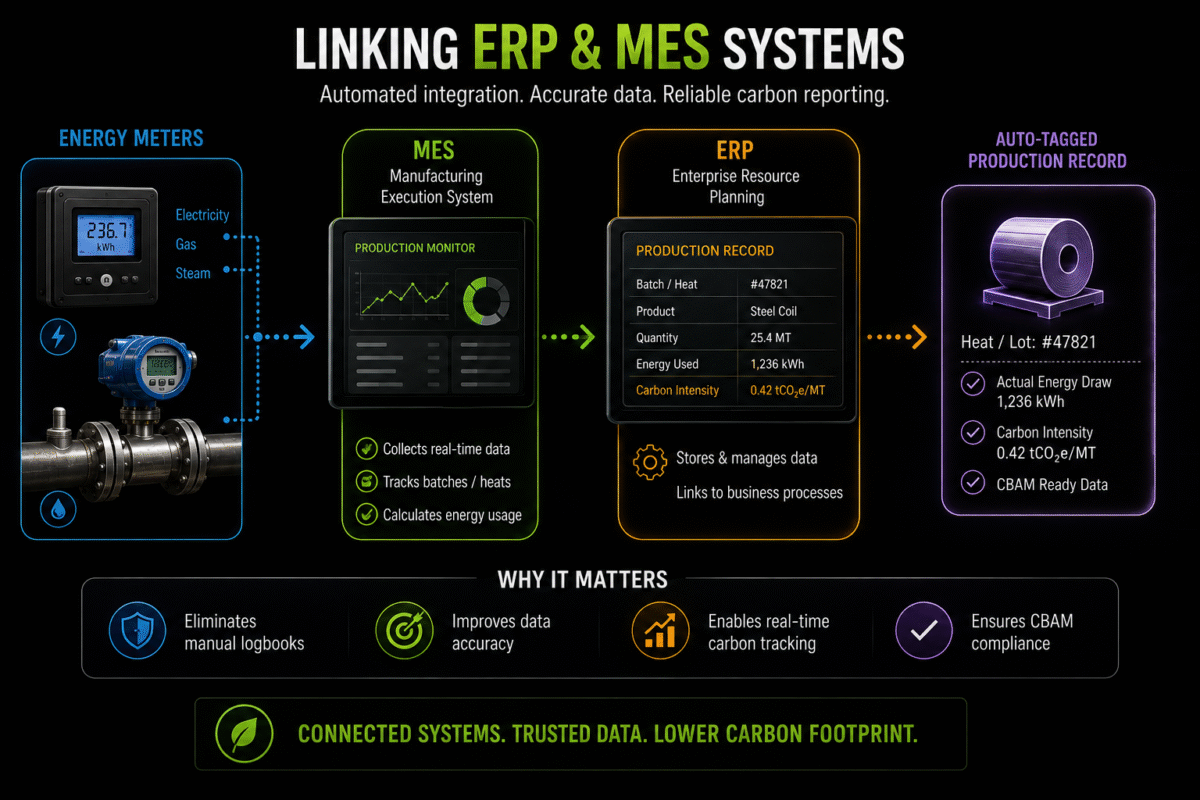
Once raw inputs are captured, shop-floor technical teams must process the raw data using EU-compliant calculation protocols. The basic mathematical structure for calculating specific embedded emissions ($SE$) per ton of product is:
SE = (E[direct] + E[indirect] + E[precursors]) / Q[production]
Where:
-
E[direct] = Total direct process and combustion CO₂ emissions inside the production boundary (in tons of CO₂).
-
E[indirect] = Electricity consumed multiplied by the specific emission factor of the grid or direct power source (in tons of CO₂).
-
E[precursors] = Total embedded emissions from purchased precursor materials consumed during the run (in tons of CO₂).
-
Q[production] = Total net mass of good, usable finished product produced during the monitoring period (in physical tons).
Common Calculation Pitfalls to Avoid
-
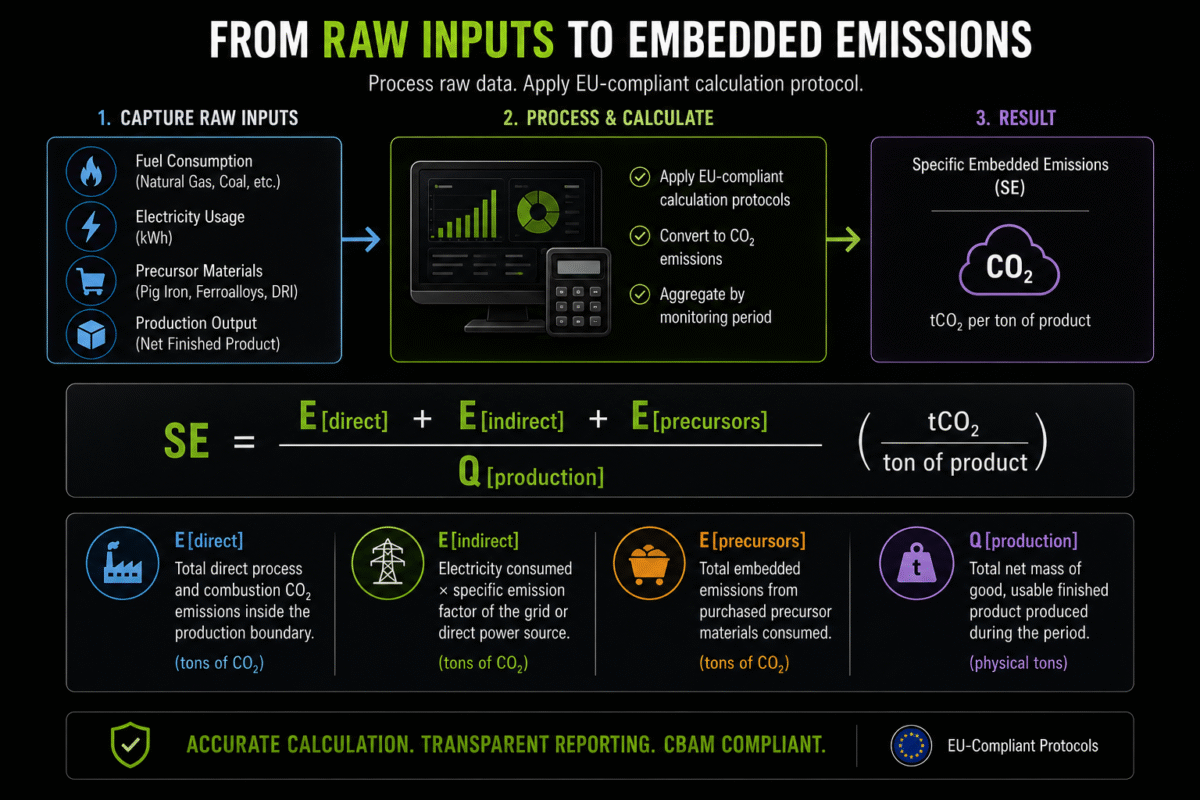
Misallocating Scrap: Counting scrap metal generated on the shop floor as finished production volume artificially inflates Q[production], resulting in an incorrectly low carbon intensity.
-
Ignoring Fuel Quality Factors: Applying standard fuel emission factors without accounting for variations in fuel density, net calorific value (NCV), or moisture content.
-
Using Grid Averages for Captive Power: If your plant uses dedicated rooftop solar or captive gas power generation, mixing that power with regional grid emission factors understates your clean energy investments.
Step 5: Preparing the Shop Floor for Third-Party Verification
CBAM compliance requires annual verification by accredited third-party verifiers. An auditor inspecting your manufacturing facility will conduct random sampling and trace a single finished part on a pallet back through your entire production chain.
Building the Audit Trail
To ensure your plant passes third-party verification without non-conformances, operations teams must maintain a centralized, tamper-evident audit trail that includes:
-
Calibration Records: Up-to-date calibration logs for all gas flow meters, electrical transformers, weighbridges, and scale equipment.
-
Raw Meter Logs: Unaltered, continuous data files from plant SCADA or power monitoring systems proving continuous monitoring.
-
Material Inventory Receipts: Purchase orders, delivery notes, and verified carbon declarations for all incoming raw materials and precursors.
-
Production Logs: Heat-wise melt shop logs showing raw material charges, power consumption curves, and final casting yields.
-
Uncertainty Analysis Documentation: Written records evaluating the potential margin of error in your measurement devices, proving compliance with EU uncertainty thresholds.
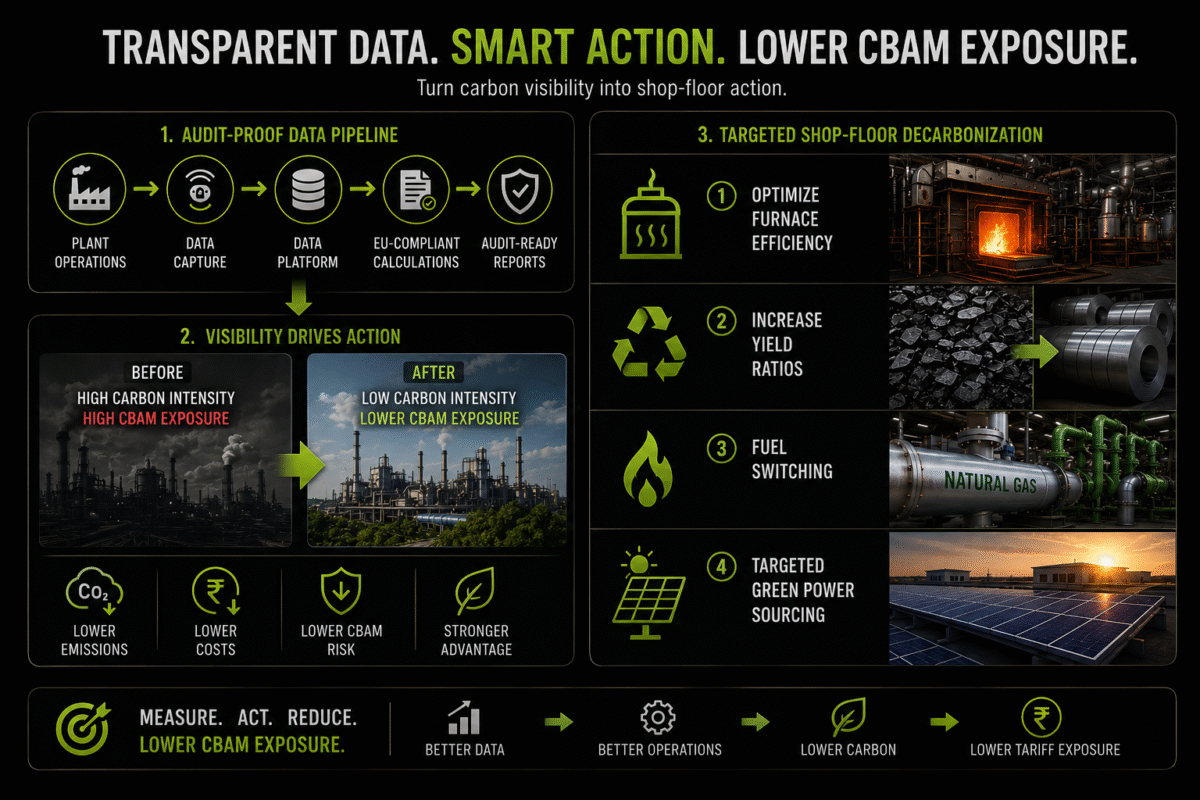
Physical Levers to Lower tCO₂/Ton Before Audit Season
Establishing an audit-proof data pipeline highlights operational inefficiencies. Once plant managers have transparent visibility into process-level carbon intensity, they can execute targeted, shop-floor decarbonization projects to reduce their tariff exposure:
-
Optimize Furnace Thermal Efficiency: Repair refractory linings, eliminate air leaks, and install waste heat recovery systems (WHRS) on flue gases to preheat combustion air or scrap metal.
-
Increase Yield Ratios: Reducing internal scrap and machining allowances directly reduces the specific energy required to produce a net ton of good finished product.
-
Fuel Switching: Replace high-carbon fuels like heavy fuel oil or coal with natural gas, LPG, or green hydrogen blends in reheating cycles.
-
Targeted Green Power Sourcing: Secure Power Purchase Agreements (PPAs) or expand rooftop solar installations dedicated specifically to continuous high-load equipment.
Carbon Intensity as a Core Manufacturing Capability
Under the EU Carbon Border Adjustment Mechanism, shop-floor carbon data directly dictates international product competitiveness. Plants that rely on manual guesswork, top-down estimations, or outdated vendor data risk exposing their customers to high carbon tariffs—or being cut out of EU supply chains entirely.
By treatment of carbon intensity (tCO₂/Ton) with the same rigor, metering, and system boundaries applied to product quality and unit cost, plant heads can build an audit-proof data ecosystem. In doing so, operations teams don’t just meet compliance demands—they transform carbon accounting into a distinct competitive advantage in global markets.